
Unleashing the Power of Poetry in Business Intelligence: Using AI to Open A New Design Door
- Jacqueline Ann DeStefano-Tangorra

- Dec 28, 2022
- 4 min read

BACKGROUND
Artificial intelligence (AI) is revolutionizing the way businesses analyze and make decisions, but did you know it can also be used to unleash the power of poetry in business intelligence? As someone who is fascinated by drawing unique connections between two unlikely-to-be-paired concepts, I am continuously searching for opportunities to pioneer net new creative solutions. Additionally, as someone who is passionate about business intelligence (“BI”) and writing poetry, I recognize there is a very unique connection that exists between the two fields--a connection that I uncovered while designing prompts within art and text AI generators--a connection that I will coin and conceptualize as Poetry Business Intelligence ("PoetryBI").

THE RELATIONSHIP BETWEEN POETRY AND BUSINESS INTELLIGENCE
It may not be immediately obvious, but there are actually some interesting connections and similarities between the two. Business intelligence involves the use of data, technology, and analysis to gain insights and support decision making in an organization. It involves collecting and organizing data, applying algorithms and other tools to extract insights, and presenting the findings in a clear and meaningful way. Poetry, on the other hand, is a form of literature that uses language and other forms of communication to express ideas and emotions. It often involves using figurative language, imagery, and other literary devices to create vivid and evocative experiences for the reader.
Despite these differences, there are some interesting connections between poetry and business intelligence. For example, poetry involves the use of language and creativity to express ideas and emotions, and these skills could potentially be useful within business intelligence when needing to communicate complex ideas and insights in a clear and compelling way. Additionally, the practice of poetry may require discipline, focus, and attention to detail, which could be beneficial within business intelligence when needing to analyze and interpret large and complex datasets.
KEY TAKEAWAYS

Working with a business intelligence consulting team that adopts a creative mindset in executing visual storytelling can enable organizations to unlock a higher level of impact in their reporting and analytics without sacrificing insightfulness. There are four major benefits to approaching business intelligence solutions from a poetic lens:
Both poetry and business intelligence can be used to make information more engaging, interesting, or impactful. Poetry can use figurative language, imagery, and other literary devices to create vivid and evocative experiences for the reader, while business intelligence can use visualizations, graphs, and other graphical elements to make data more accessible and understandable.
Both poetry and business intelligence can help to reveal insights or patterns that may not be immediately apparent from the raw data or facts. Poetry can use figurative language and imagery to highlight connections, emotions, or observations that may not be immediately obvious, while business intelligence can use algorithms and other tools to identify trends, correlations, or anomalies in the data.
Both poetry and business intelligence can be used to communicate complex or abstract ideas in a more accessible or intuitive way. Poetry can use metaphors, similes, and other literary devices to make complex concepts more relatable or understandable, while business intelligence can use visualizations and other graphical elements to make complex data more intuitive and interactive.
Both poetry and business intelligence can be used as a form of expression or storytelling. Poetry can be used to express personal experiences, emotions, or observations, while business intelligence can be used to tell stories or illustrate trends or events using data and analysis.
There are five poetic elements that users of business intelligence dashboards may inherently search for when evaluating the quality and impact of the data visualizations. In incorporating these five elements within your dashboard designs, you will offer a unique and powerful experience for many of your end users.

Rhythm: Create a sense of rhythm or flow through the use of repeating patterns or shapes, or by organizing the data in a way that follows a natural progression or sequence.
Imagery: Create vivid and evocative imagery through the use of color, shape, and line to represent different data points or trends.
Sound: Evoke sounds or musical elements through the use of repetition, contrast, and variation in the data.
Emotion: Convey emotions or moods through the use of color, tone, and other design elements.
Narrative: Tell a story or convey a message through the use of data and visual elements, creating a sense of progression or development.
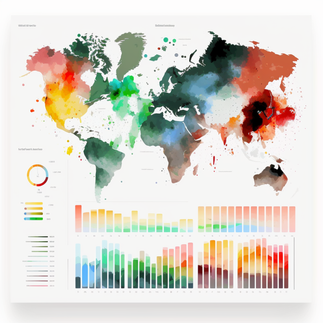
POETIC BUSINESS INTELLIGENCE DASHBOARD EXAMPLES (AI)
Some of my AI-Generated Artwork examples below show how data visualization elements and business intelligence dashboards can be utilized in a poetic way to drive an impactful story across an organization, an industry, etc. Note these are AI-generated images, not client data, and are not meant to demonstrate insightfulness based on what is displayed in the images, but rather exquisite design and storytelling capabilities that can transpire into producing rhythm, generating imagery, evoking sound, conveying emotion, and telling a unique story.


CONCLUSION
As a result of my work above, I found that using AI to generate dashboard examples can open new, innovative doors for data visualists, UI/UX/graphic designers, and other related groups of professionals that may find these designs interesting to explore when uncovering and designing a data-driven story in business intelligence. Data design professionals can explore new possibilities and push the boundaries of traditional data visualization techniques when they are inspired by fresh approaches and creative solutions, leading to more engaging, effective, and poetic data storytelling.
If you are interested in learning more about how to incorporate poetic elements into your data visualizations, please feel free to message me.
For more articles like this, please follow Omni Business Intelligence Solutions. Note that parts of the article were generated utilizing ChatGPT3, and all illustrations within are generated using MidJourney AI. All ideas and prompts are 100% original of Jacqueline DeStefano, Founder of OBIS.


Comments